Tabulating and summarizing are common activities when exploring a new dataset. Tabulating can be useful when laying out categorical variables while summarizing is more applicable to continuous variables. We looked at the summarize command in another post, in this one we'll look at tabulating in particular. Tabulating data in Stata is done by using the following commands:
tab
table
tabstat
The tab command tabulates variables wheras table and tabstat are used to create custom tabulations. The nlsw88 dataset contains quite many categorical variables, so let's load this and try out some of these commands:
sysuse nlsw88, clear
tab occupation
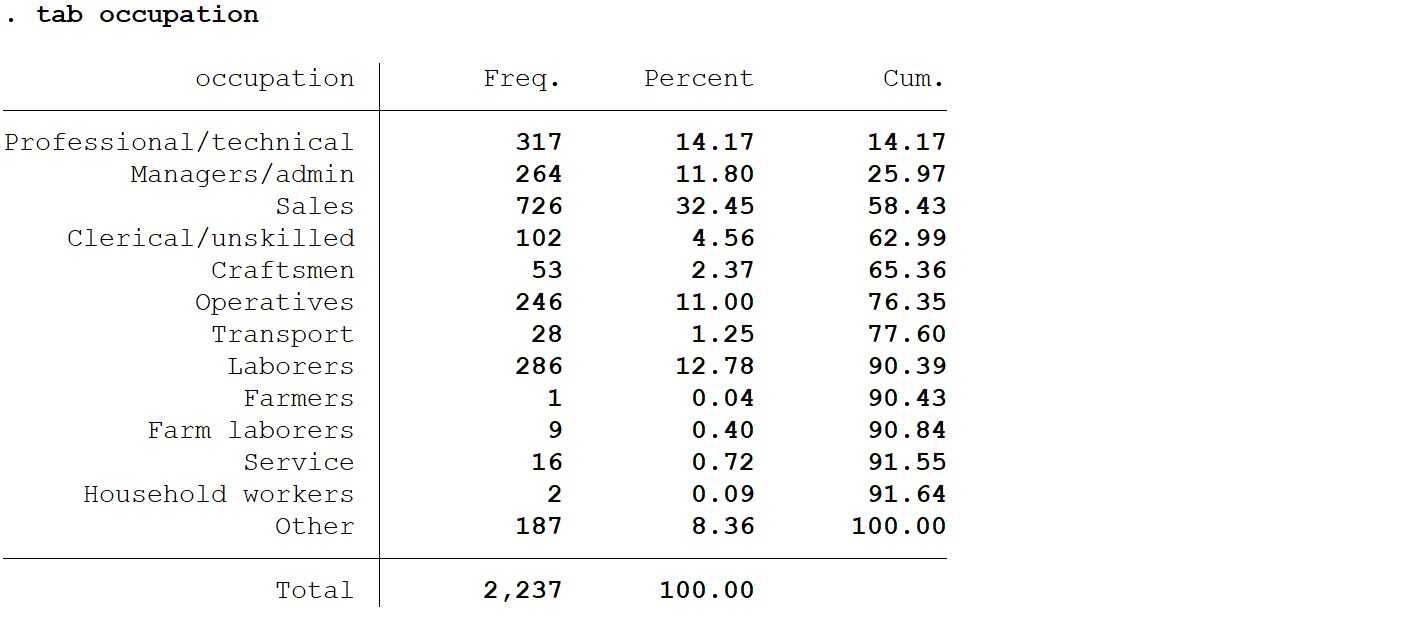
So we can see there 13 categories in the occupation variable some of them containing very few observations. There are other categorical variables in this dataset as well, such as race, industry and more.
To run a two-way tabulation, let's tabulate race against union:
tab race union, col row
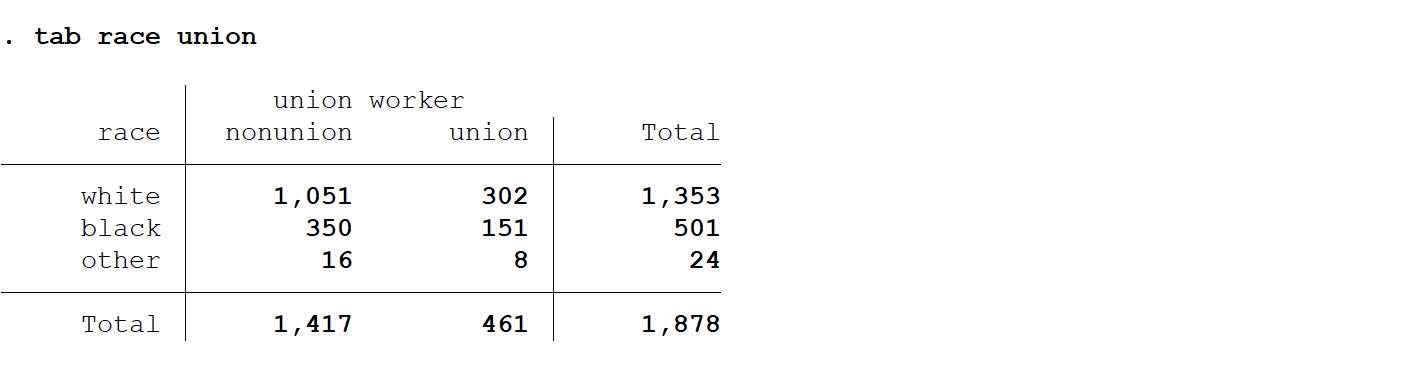
Here we can see that less than a third of white women seem to union members, wheras more than 30% of black women and other are union members.
In Stata it is also possible to create three-way tabulations, we'll look at this in more detail in another post.