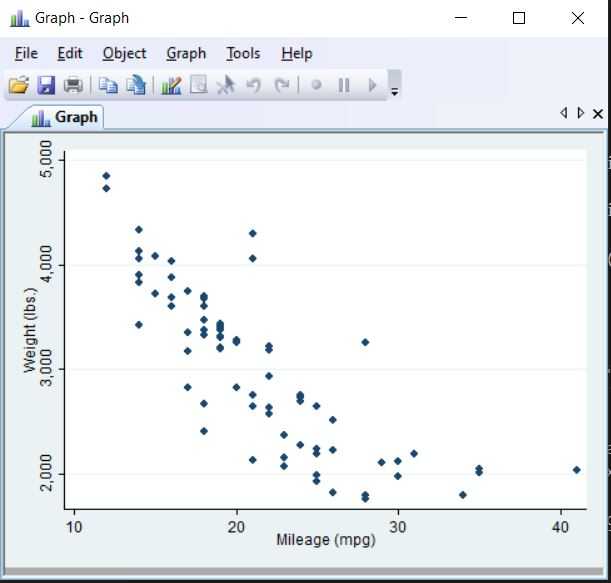
In a previous post we looked at performing basic graphic visualizations in Stata. It is also possible to save graphics in a number of formats such as .gph (Stata proprietary graphics format), .png, .pdf and more. If you have a PowerPoint presentation for instance (but your data is not in the MS-stack but in Stata), you should use the .emf extension which is a decicated graphics format. Let’s have a look creating a scatterplot (two-way) and then saving it:
sysuse auto, clear
twoway (scatter weight mpg)
graph save Graph "C:\Graphics\scatter.emf", replace
Note that this could be performed as one-liner,
twoway (scatter weight mpg), saving("C:\Graphics\scatter.emf", replace)
Or if you’re comfortable saving to your working directory in the default format (.gph), simply
twoway (scatter weight mpg), saving(scatter, replace)
